As purchases are increasingly researched and made online, understanding the performance of your digital marketing has never been more vital.
The most important part of any digital campaign is the end destination, the place that all of your marketing funnels lead to – your website.
But how do you know if your website is performing?
Read on to learn 10 trackable metrics that you need to know.
What Your Website Means to Your Business
Did you know that your website is actually considered an asset? This might seem a little odd given you can’t actually see it or touch it, like you would a car. But just like a car, you’ve paid for it, it needs routine maintenance, you need to pay registration fees and if something goes wrong with it, it can have a major impact on you.
So now ask yourself, would you keep a car that can’t get you to your destination? And what would your friends think if you offered them a lift in it?
I’ll bet your answer was, “I wouldn’t, and they’d rather travel with another competitor friend!”
If that’s the case, now ask yourself why you would settle for a website that can’t get conversions? And think about how your customers would feel if they landed on your website and the page didn’t load?
Once again, the answer should be “I wouldn’t, and they’d rather visit a competitor’s site. ”
Why You Need to Track Your Metrics
Unlike a car, the signs of a poor performing website aren’t obvious. You can’t see steam coming from the radiator or feel the drag of a dodgy wheel alignment. Website performance issues can be very subtle, and can change over time.
To troubleshoot an underperforming website, here are 10 essential trackable metrics.
1. Website Speed
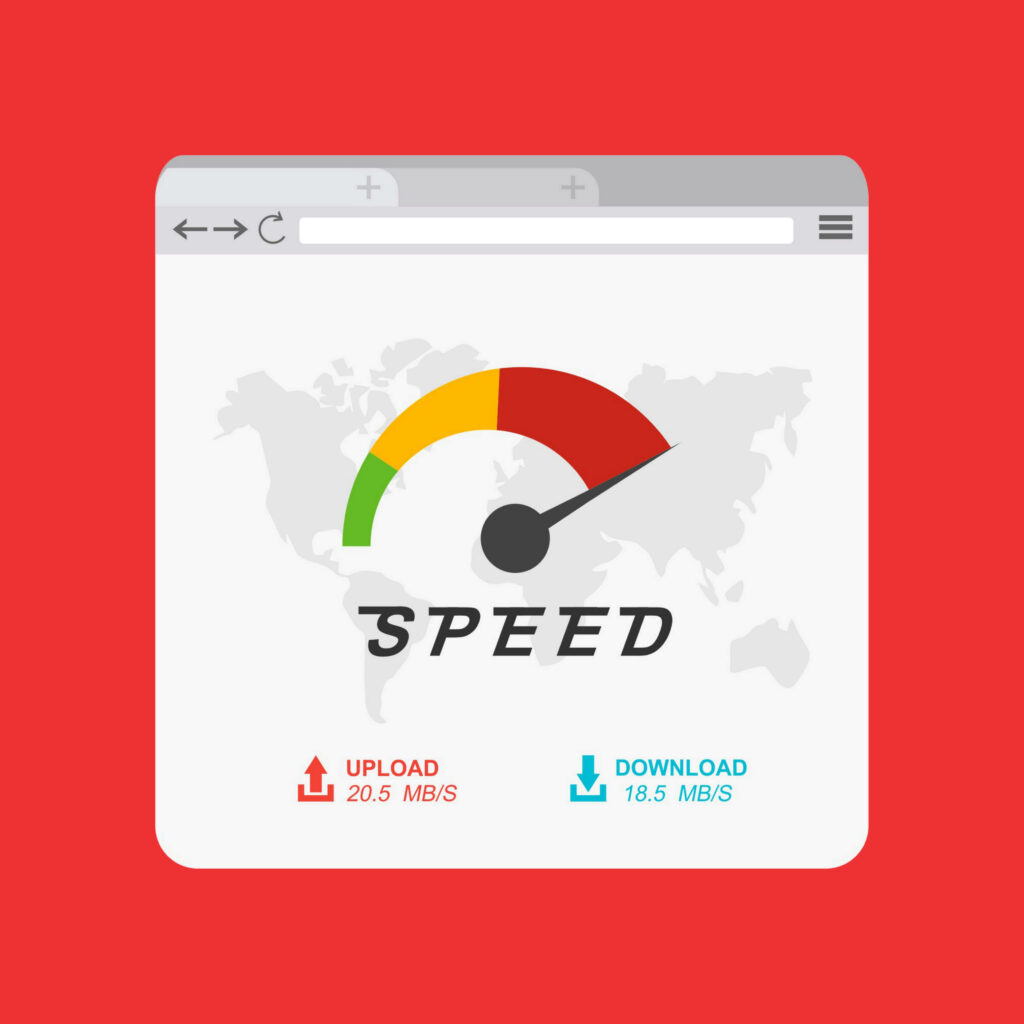
The first thing you should be checking is your website speed. And no – this doesn’t mean hitting refresh and busting out the stopwatch! Instead, use GTmetrix and Page Speed Analytics, two of the best free SEO tools available for testing your website speed.
Website speed covers two things, the time it takes for a webpage and its elements to load, and the time it takes to navigate.
Time to Load
If a website has too many assets, or if the assets haven’t been optimised and compressed well enough, it can result in slow loading times. While video puts the most strain on a webpage, any element, including simple text, still needs to be loaded before it can be displayed.
To improve the speed of these assets, make sure that image file sizes are always less than 100 Kb, and that your videos are as compressed as possible. You can also consider hosting them from a different site.
Did you know that 47% of consumers expect web pages to load in just 2 seconds?
The internet has a practically infinite number of places that your potential customer could visit. All it takes is one click to leave your site, so you can’t afford to lose precious seconds to a slow loading webpage.
People are becoming more cyber-security savvy. They associate poor opening speeds with an unreliable website filled with malicious pop-ups that are slowing it down. You don’t want consumers avoiding you because they don’t think your site is legitimate.
Time to Interactive
While an initially slow loading time might deter people from visiting your site, a clunky onsite experience will make them leave just as quickly.
The more time it takes for someone to do simple things like click links, activate drop-down menus or even scroll, the more likely that they will get frustrated and leave.
While pop-ups displays are effective, they need to be used sparingly. They are great for directing the customer to do what you want them to do, but that isn’t necessarily what they want to do.
If you are bombarding your customers with pop-ups that slow down their interactions, it will feel like spam and they will leave.
Pop-ups can also contribute to slowing down loading and scrolling speeds if they are poorly implemented, or used on an already strained webpage.
2. Error Rate
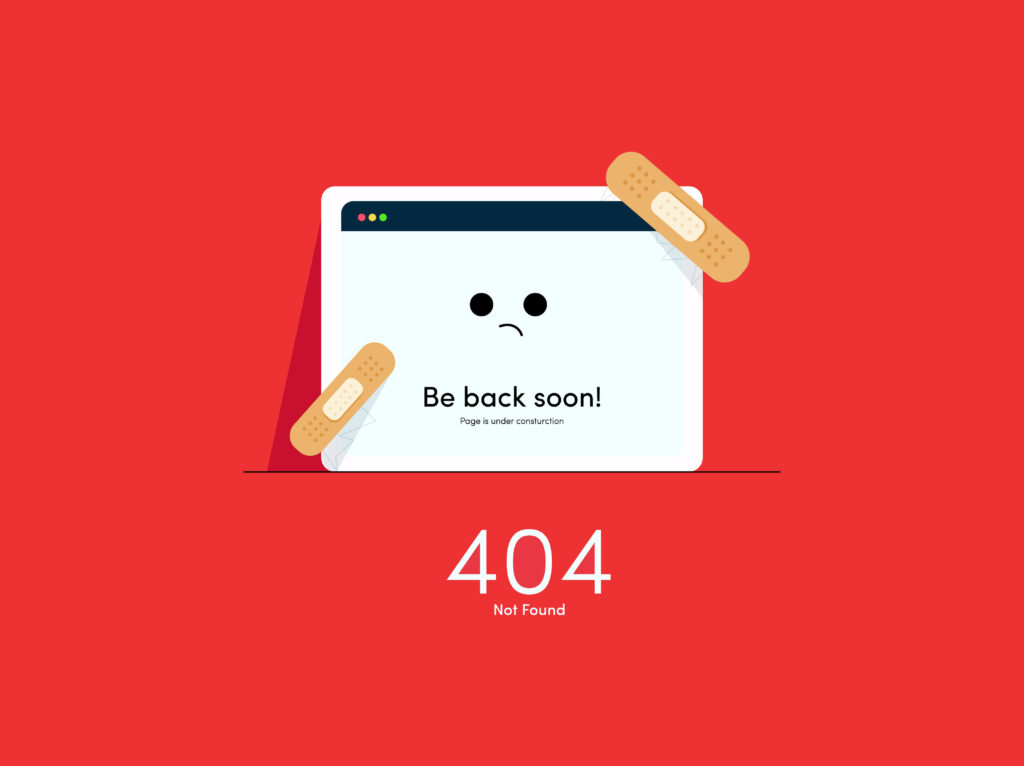
Imagine your website is like a factory conveyor belt. If you noticed that the belt is starting to rattle, you would fix it preemptively, rather than waiting until the entire machine broke down. The goal in an assembly line is for it to always keep moving. Time is money.
A website is no different. If a website is down for any length of time, all of the efforts of your marketing channels are being wasted. Imagine paying for clicks with a Google Ad campaign, just for the links to lead to a 404 error! Even worse, it will make you seem amateurish or unreliable which will affect your brand reputation.
Put simply – you can’t convert customers if they can’t contact you, and if they can’t contact you, they won’t trust you.
Your error rate is the percentage of request errors that occur versus the number of fulfilled requests. If you notice an increasing number of error requests, this is the equivalent of your website rattling. Locate the issue and fix it before it brings down your site – and your sales.
3. Conversion Rate
Your conversion rate – the percentage of people that visit your site and make contact or a purchase – is probably the most important trackable metric. This is because no matter how good all of your marketing channels are, if your website doesn’t convert the leads you are wasting your time.
A good website converts between 2-5% of all of its visitors. If your website is sitting outside of this range, you need to know why.
If you are below 2% but are getting high traffic, you know that getting leads isn’t the problem. This should suggest that you need to revamp your website, change your Call to Actions (CTAs), change your offer etc. It could also mean your leads are low quality, and you are marketing to the wrong audience.
On the flip side, if you are experiencing low traffic but your conversion rate is 5%, you’ll want to seriously consider investing in your marketing. You already know that you can convert at a high rate, so your focus should be on lead attraction and lead nurturing.
You can learn more about the lead nurturing process here.
4. Unique and Repeat Visitors
While all visitors are good, some are better than others. Unless your business offers repeat services, you want to see your unique customer visits rising, because they are the ones that are going to make a purchase.
If all you have is return customers, even if they are making repeat purchases, it suggests your marketing efforts need a revamp.
5. Session Data
Understanding when and for how long a person interacted with your site is crucial for improving it.
Average Session Time
If a session goes for a long time, you can reasonably assume that the visitor was engaged by the content. This means that overall, if your average session time is a few minutes, your website is successfully holding peoples’ interest.
Average Page Views Per Session
Whether the number of average page views is good or bad depends on how complex you need your site to be. If you have an Ecommerce site with a dozen item categories, but the average page views is really low, your site might be too overwhelming for people to navigate.
In contrast, if your site only offers one service, and average pages are high, you might be making people jump through too many hoops to find your contact page.
Average Time Spent on Page
To provide even further clarity, you can review the average time spent on individual pages. For example, you may have a long video embedded on a commonly visited page, but the page viewing times are low. This means people are being intrigued by the video, but are then seeing the run-time and choosing not to watch it.
With this data, you could shorten the video, or try a different form of content. Average time spent on a page can be great for experimenting with different content combinations.
Important Caveat for Session Data
All timed session data can be skewed by people simply leaving the page open. It doesn’t always mean they are engaged with it. These trackable metrics are best used in conjunction with other metrics on this list to get a more accurate picture of your visitor behaviour.
6. Bounce Rate
A ‘bounce’ is someone who enters your site and leaves without interacting with it. These are tracked with a bounce rate, which is the total number of bounces divided by the total number of visits.
A high bounce rate isn’t good – it means a lot of people have landed and not liked what they saw, or that your site loaded too slowly for them to stick around.
With that said, don’t just look at the bounce rate and get upset – think about it critically.
If your landing page has a high bounce rate, try different content, less clunky assets, or different messaging. If the entry point is a page like a blog, you know that the blog content wasn’t engaging. Once again, when armed with this trackable metric you can amend accordingly.
7. Exit and Top Pages
Exit pages, the last page a person visits before leaving your website, are an ‘x marks the spot’ for which pages need improvement. Ideally, the most exited page is your contact or checkout page, because at that point the customer has hopefully been converted.
However, if your most exited page is your landing page, you know that you’ve got a problem. Either your landing page isn’t interesting, or your leads don’t know where to go to find your contact form.
The opposite of exit pages, top pages show you which pages people visit the most. While this will almost always be your landing page, it can reveal things like which of your listed services are viewed the most, or highlight an unexpectedly popular blog.
8. Click Through Rate (CTR)
Google defines CTR as the number of clicks your ad or website link receives, divided by the amount of people who viewed it, known as impressions. While this is an essential trackable metric, it is hard to say whether your CTR is good or bad.
A widely agreed upon ‘good’ average CTR in Google Ads is 4-5% for search and 0.5-1% for display. With that said, you need to be critical of your results.
If you have a much higher than average number of clicks, make sure your conversions are higher as well. Otherwise, you are spending more clicks without recouping that money on sales. If this is the case, you might need to consider targeting a more specific audience to increase your conversion rate and lower your ad cost.
9. Traffic Source
While the performance of on-page CTA’s is essential, if your marketing channels aren’t attracting any leads, they can’t convert anything. Urchin Tracking Modules (UTMs) are an excellent way of measuring the success of your marketing. They can tell you the specific CTAs that generate a click-through to your website.
They can also help you decide which marketing channel to focus on. For instance, if you have high Google ad traffic at a 2% conversion rate, while your social media has less traffic but converts at 10%, it might be worth investing more into your social channel.
10. Types of Devices

Did you know that there are over 6.5 billion smartphone subscriptions in the world right now? That’s 6.5 billion phones that could access your website, rather than through desktop computers.
While you should be striving to appeal to both, understanding the percentage of mobile vs computer users who access your website should affect how your webpages are structured and what content is on them.
These days, not optimising your website for mobile is a rookie mistake!
Have You Considered a Marketing Agency
Now that you have a comprehensive list of trackable metrics, you might be wondering which ones to focus on first.
Unfortunately, there is no simple answer to that question. Depending on the type, size and ambitions of your business, you need to set goals and targets that will fulfil your strategy.
For expert strategic advice, as well as allowing us to track and improve your website metrics for you, contact Oddball Marketing Agency. Get the website you need – get an Oddball website that performs.